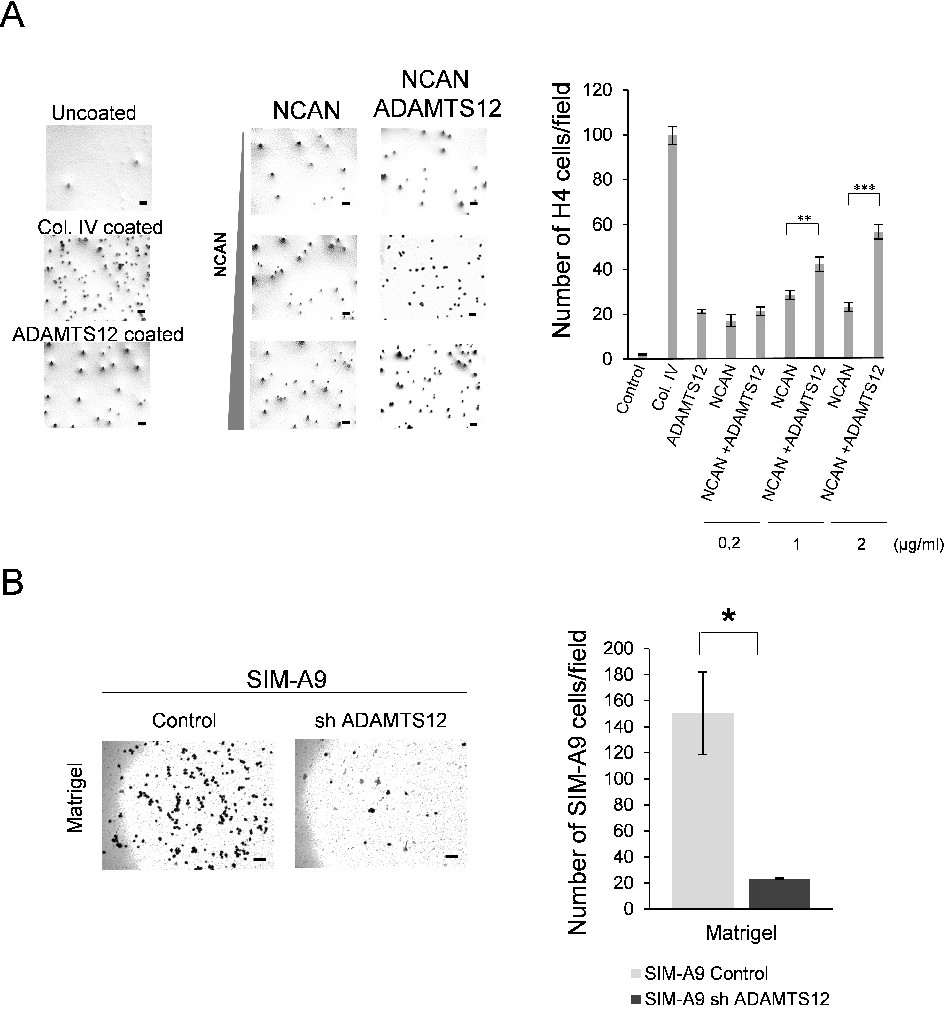
Fig. 3. The presence of neurocan and ADAMTS12 modifies the adhesion profile of human neuroglioma H4 cells and mouse microglial SIM-A9 cells. A. Left, representative images of H4 cells adhered to the indicated molecules following incubation for 1 h. Neurocan (NCAN) was dispensed in increasing amounts (0.2, 1.0, and 2.0 µg/mL), and the same increasing amounts of neurocan were digested with ADAMTS12 (NCAN + ADAMTS12). Right, graphical representation of the number of adherent cells per field. Uncoated dishes were used as a negative control, and dishes coated with type IV collagen (col. IV) were used as a positive control. B. Left, representative images of control and ADAMTS12 RNAi (shADAMTS12) SIM-A9 cells adhered to Matrigel. Right, graphical representation of the number of cells per field. *p<0.05, **p<0.01, ***p<0.005. Scale bar: 100 µm.